By Neda Vahabzad, Pedro Vergara Barrios
As ports electrify their operations and accelerate the deployment of renewable energy and alternative fuels, their electrical grids face growing stress, uncertainty, and operational complexity. Demo 2 of the MAGPIE project tackles this challenge by developing the Smart Energy Systems Simulator Tool (SESST)—a modular decision-support tool that links realistic demand forecasting with detailed grid assessment. Applied to the Port of Sines, SESST allows stakeholders to anticipate congestion risks, evaluate investment options, and identify optimal strategies for integrating new green technologies.
At its core, SESST consists of two tightly connected components:
- Scenario Generation Tool that produces realistic short-term demand forecasts for different future years; and
- Grid Assessment Module that evaluates technical performance, congestion patterns, and operational costs under those scenarios.
Together, they form a “digital testbed” for analyzing the future energy system of ports.
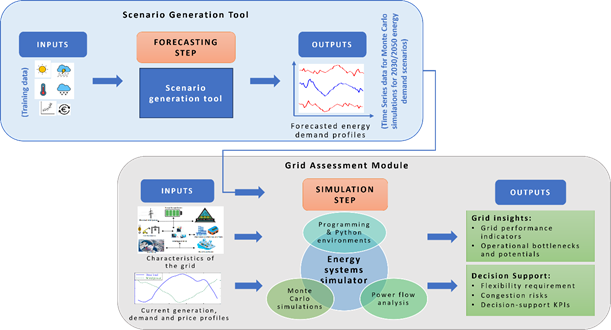
Figure 1. SESST architecture, showing the link between the scenario generation tool and the grid assessment module.
Key takeaways (an integrated, scalable tool chain):
SESST has been designed as a generalized and scalable framework rather than a one-off model. Its modular structure allows users to plug in different electrical networks, datasets, and development strategies. This makes it readily transferable to other European ports looking to manage grid expansion, renewable integration, and increasing electrification.
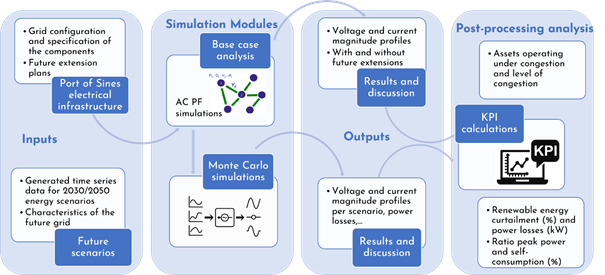
Figure 2. grid assessment module and its main inputs/outputs
Realistic future demand scenarios:
The scenario generation tool uses historical load, weather and price data to generate multiple plausible 24-hour demand profiles for different seasons and years (e.g. 2030, 2050). This functional, scenario-based approach captures seasonal variability and uncertainty, providing a richer view than single-point forecasts and enabling Monte Carlo analyses of grid operation.
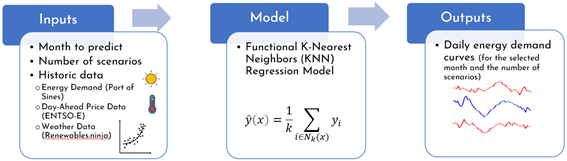
Figure 3. scenario generation tool and its inputs/outputs
Deep insights from the Port of Sines case study:
Using a detailed model of the 30 kV network and its connections to the 15, 6, and 6.6 kV systems, SESST assesses four operational modes that combine different levels of grid connectivity and renewable deployment. The results show that voltage quality remains robust in future configurations, but several lines experience persistent congestion, with certain feeders overloaded for up to 20–24 hours per day. To further quantify risk, SESST generates cumulative probability distributions of voltage and line loading violations, showing the probability that any hour within the year exceeds operational limits.
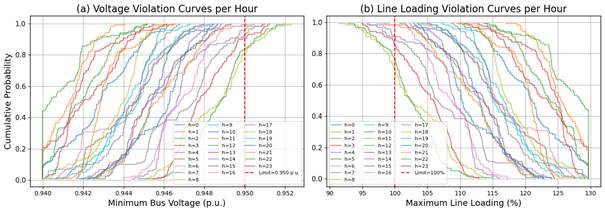
Figure 4. Cumulative probability curves of (a) voltage and (b) line loading violations for each hour across all scenarios
Renewables are fully used, but self-sufficiency remains low:
Across both base and scenario cases, all locally generated PV is self-consumed (100% self-consumption), yet overall self-sufficiency remains relatively modest because total demand significantly exceeds local renewable production. Modes including new PV in extension areas (e.g. Mode 3) clearly improve self-sufficiency, but the analyses confirm that further renewable capacity will be needed to match the strong growth in electrified demand at the port.
Actionable KPIs for planning and investment:
SESST quantifies a broad set of technical and economic KPIs, including:
- frequency and duration of congestion,
- transformer and line loading,
- voltage levels distribution,
- power losses,
- operational congestion costs,
- and added the economic value of local RES.
For example, modes with significant PV self-consumption generate approximately €1,285 per hour in added value, compared to €25 per hour in low-RES modes, highlighting the economic benefits of integrating renewables even within a constrained network.
Future Utilization
Looking beyond the Port of Sines, SESST provides a reusable, transparent, and standardized toolbox for ports and DSOs that need to test future energy transition pathways before committing to large investments. By combining transparent data protocols, standardized formats, and clear governance arrangements, the tool can be integrated into port planning processes, regulatory studies, and stakeholder dialogues. Its results can be translated into dashboards and communication material for non-technical audiences, helping to build social acceptance for new infrastructure, renewable projects, and flexibility solutions. In this way, Demo 2 delivers more than a technical model: it provides a robust foundation for planning resilient, congestion-aware, and low-carbon energy systems in European ports.