How do you explain to your partners and to the general public what the future deliverables are?
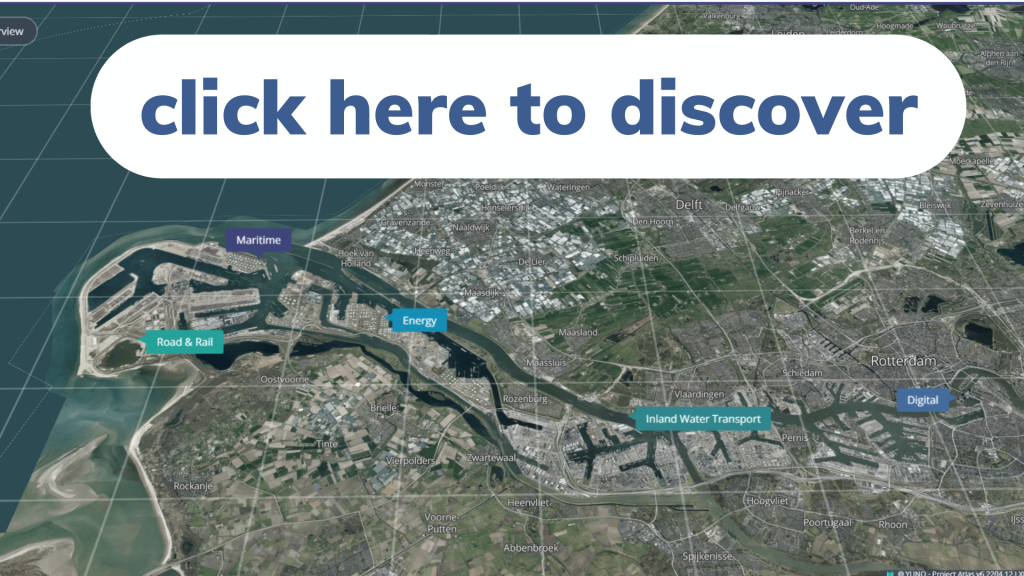
With this question in mind, MAGPIE has created an interactive map to help visualize the demonstrators that are currently being developed and their interactions with the port-city area. The MAGPIE project has a lead time of 5 years and at this moment it is partly ‘looking into’ the future. We want to create a clear overview and explain our demos in the right context and location.
The MAGPIE Project consists of ten work packages involving the testing and demonstration of technical and non-technological innovations. With this interactive map, we want to give a brief insight into these projects. When clicking on each demo, a brief introduction and pictures of the demo are provided.
As the demos are currently being tested in Rotterdam, the map is focused on this area. Once the demos are upscaled to the other ports in the consortium – HAROPA Ports, Port of Sines and the Algarve, and Deltaport – the aim is to widen the map to include the locations of the upscaled demos in these other ports.
“It’s a great tool to use in a presentation to give an insight in the different demo’s,”
“Besides, we will continuously update the content. The tool is available for everyone, it is an online tool that you can find on the MAGPIE website.”
Reyer Will (Manager MAGPIE project)
If you would like to see the interactive map, please use the following link: Project Atlas | interactive map port of magpie